
 Best Sellers
 Metabolic
 Regenerative
 Secretagogues
 Bioregulators
 Neuropeptides








Introduction
The ghrelin receptor is an established target in secretagogue peptide research. It provides laboratories with a defined system for studying how synthetic peptides interact with a G-protein-coupled receptor. Ipamorelin is a reference compound examined in receptor-activation studies. This article explains the receptor, how laboratory models are developed, and how Ipamorelin is studied in receptor research.
What Is the Ghrelin Receptor?
The ghrelin receptor is a protein located in the cell membrane that binds the peptide ghrelin. Ghrelin is a short chain of amino acids produced mainly in the stomach. When ghrelin binds to the receptor, the receptor changes shape and initiates a signaling process inside the cell.
The receptor belongs to the G-protein-coupled receptor family. A G-protein-coupled receptor is a membrane protein that crosses the cell membrane seven times and transmits signals through an associated G-protein. This large protein family includes receptors for many small molecules and peptides.
The receptor is also known as GHS-R1a, which stands for growth hormone secretagogue receptor type 1a. A secretagogue is a substance associated with the release of another substance. The term reflects the receptor’s role in growth-hormone signaling research.
The gene encoding the receptor is called GHSR. Two main forms are described in research literature. GHS-R1a is the full-length form commonly expressed in laboratory cell lines. GHS-R1b is a shorter, truncated form that lacks part of the structure required for typical receptor signaling. Its function remains an area of investigation.
Ipamorelin as a Research Agonist
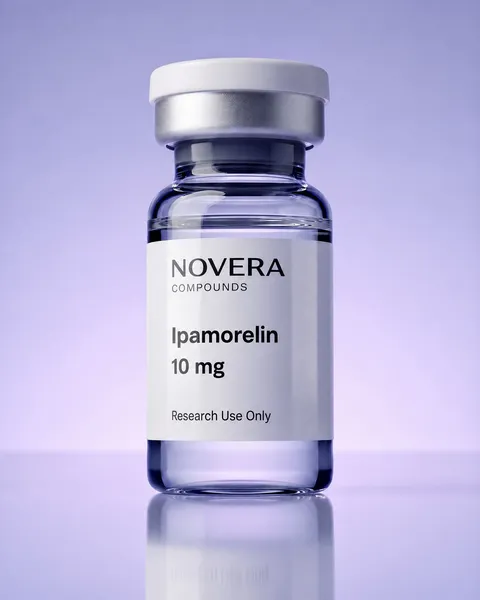
Ipamorelin is a synthetic pentapeptide. A pentapeptide is a molecule made up of five amino acids. It is studied as a selective growth-hormone secretagogue and as a reference agonist in GHS-R1a activation research.
An agonist is a molecule that binds to a receptor and activates it. Selectivity describes the degree to which a compound interacts with one receptor compared with other receptors. These properties are assessed experimentally and depend on the assay conditions and comparison compounds used.
How Ghrelin Receptor Models Work
Receptor expression systems
A laboratory model is a controlled system used to measure a specific interaction. For receptor research, the model often consists of cultured cells engineered to express the receptor being investigated.

Expression means producing a protein inside a cell. Researchers can introduce a plasmid carrying the GHSR sequence into a cell line through a process called transfection. A plasmid is a small DNA molecule that carries genetic information, while transfection introduces that material into a cell.
Common host cell lines include HEK293 and CHO cells. HEK293 is a human embryonic kidney cell line, while CHO refers to Chinese hamster ovary cells. Both are widely used in laboratory research because they can be engineered to express selected receptors.
A stable cell line continues expressing the introduced receptor across multiple passages. A transient cell line expresses it for a shorter period following transfection.
Controls in receptor models
Reliable receptor models include appropriate controls. A mock-transfected cell line receives the plasmid backbone without the receptor sequence. This helps researchers assess background activity from the host cells.
A positive-control ligand is a compound known to activate the receptor under defined assay conditions. It helps confirm that the assay is functioning as expected.
Receptor-binding assays
A receptor-binding assay measures how a compound interacts with a receptor. One common format is a competition assay, in which a labeled tracer is added to a receptor-containing membrane preparation. A labeled tracer is a molecule carrying a detectable tag, such as a radioisotope or fluorescent group.
Researchers then add increasing concentrations of an unlabeled test compound. If the compound competes for the same binding site, it may displace the tracer. The remaining signal is measured and plotted against concentration.
The resulting curve can be used to estimate affinity-related values. IC50 is the concentration that reduces the measured tracer binding by 50% under the specified assay conditions. Ki is a calculated inhibition constant that accounts for the tracer’s affinity and concentration.
These measurements support comparisons within defined experimental systems. They do not, by themselves, establish activity or outcomes in a living organism.
Second-messenger cascade analysis
Second-messenger cascade analysis examines the signals that follow receptor activation. A second messenger is a molecule that relays a signal inside a cell after a receptor is activated. GHS-R1a signaling is primarily associated with the Gq protein pathway. Gq activates an enzyme called phospholipase C, which splits a membrane lipid into two signaling molecules.
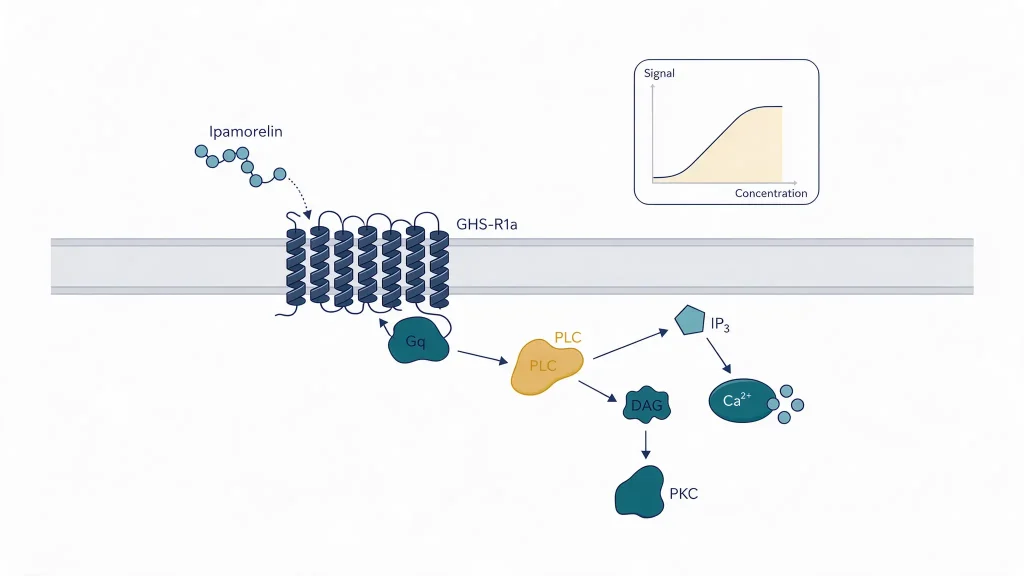
These molecules are IP3 and DAG. IP3 stands for inositol trisphosphate, which promotes calcium release from intracellular stores. DAG stands for diacylglycerol, which remains in the membrane and helps recruit protein kinase C. Protein kinase C is an enzyme that modifies other proteins through phosphorylation, a process that can regulate their activity.
Laboratories can examine these events using calcium-flux assays. A calcium-flux assay uses a fluorescent dye that changes its signal in response to calcium levels. A fluorescence plate reader measures the signal over time, allowing researchers to examine changes associated with receptor activation.
Ipamorelin can serve as a reference agonist in these assays. Its measured signal can be compared with those of other secretagogue peptides tested under the same conditions.
Why This Is Studied
Secretagogue research often uses panels of related compounds rather than examining one compound in isolation. A panel is a group of compounds tested side by side under defined conditions. This approach helps researchers compare receptor binding, potency, and signal amplitude.
Potency describes the concentration required to produce a specified response in an assay. Selectivity describes how strongly a compound favors one receptor over others. Both measurements depend on the experimental system and should be interpreted within that context.
Ipamorelin may be examined alongside other GHS-R1a ligands or compounds associated with different signaling pathways. Such comparisons help researchers distinguish receptor-related activity from background signals and identify differences between experimental compounds.
For additional background, see the article on GHRH-related signaling research. The companion article on CJC-1295 and Ipamorelin receptor activation studies explores related receptor research. The guide to second-messenger cascade analysis provides further context on downstream signaling measurements.
The Ipamorelin research peptide page and the secretagogue peptides category provide related compound information for qualified research professionals evaluating research-grade materials.
For Research Use Only
Ghrelin receptor models provide controlled systems for investigating receptor binding and signaling. Findings depend on the cell model, assay design, controls, and experimental conditions. Binding measurements and cellular signals should not be interpreted as evidence of clinical effects or as proof of safety.
Ipamorelin and the related compounds discussed in this article are proposed for in-vitro laboratory research purposes only. The information is intended for qualified research professionals handling research-grade compounds. It does not constitute clinical guidance, prescribing information, or recommendations for human or veterinary use.
For research use only. This content is provided for in-vitro laboratory research purposes. The compounds discussed are not for human consumption and are not approved by the FDA or EMA to prevent, treat, or cure any condition. Introduction into humans or animals is prohibited by law.
References
- Howard AD, et al. Science. 1996;273(5277):974-977.
- Kojima M, et al. Nature. 1999;402(6762):656-660.
- Davenport AP, et al. Pharmacol Rev. 2005;57(4):541-546.
- Kojima M, Kangawa K. Physiol Rev. 2005;85(2):495-522.
- Müller TD, et al. Mol Metab. 2015;4(6):437-460.
- Pierce KL, Premont RT, Lefkowitz RJ. Nat Rev Mol Cell Biol. 2002;3(9):639-650.
- Fredriksson R, et al. Mol Pharmacol. 2003;63(6):1256-1272.
- Petersenn S, et al. Endocrinology. 2001;142(6):2649-2659.
- Leung PK, et al. Cell Signal. 2007;19(5):1011-1022.
- Camina JP. J Neuroendocrinol. 2006;18(1):65-76.
- Yin Y, Li Y, Zhang W. Int J Mol Sci. 2014;15(3):4837-4855.
- Holst B, et al. Mol Endocrinol. 2003;17(11):2201-2210.
- Wang Y, et al. Nat Commun. 2021;12(1):5064.
- Liu H, et al. Nat Commun. 2021;12(1):6410.
- Raun K, et al. Eur J Endocrinol. 1998;139(5):552-561.
- Smith RG. Endocr Rev. 2005;26(3):346-360.
- Hulme EC, Trevethick MA. Br J Pharmacol. 2010;161(6):1219-1237.
- Cheng Y, Prusoff WH. Biochem Pharmacol. 1973;22(23):3099-3108.
- Bylund DB, Toews ML. Am J Physiol. 1993;265(5 Pt 1):L421-L429.
- Grynkiewicz G, Poenie M, Tsien RY. J Biol Chem. 1985;260(6):3440-3450.
- Berridge MJ, et al. Nat Rev Mol Cell Biol. 2003;4(7):517-529.
- Zhang Y, et al. J Biomol Screen. 2003;8(5):571-577.